Displays a 3D curve given as the input filename (with possibly projections and/or tangent information) by using QGLviewer.
Usage: 3dCurveViewer [options] input
Allowed options are :
-h [ --help ] display this message
-i [ --input ] arg the name of the text file containing the list
of 3D points (x y z per line)
-b [ --box ] arg (=0) specifies the the tightness of the bounding box
around the curve with a given integer
displacement <arg> to enlarge it (0 is tight)
-v [ --viewBox ] arg (=WIRED) displays the bounding box, <arg>=WIRED means
that only edges are displayed, <arg>=COLORED
adds colors for planes (XY is red, XZ green,
YZ, blue).
-C [ --curve3d ] displays the 3D curve
-c [ --curve2d ] displays the 2D projections of the 3D curve on
the bounding box
-3 [ --cover3d ] displays the 3D tangential cover of the curve
-2 [ --cover2d ] displays the 2D projections of the 3D
tangential cover of the curve
-n [ --nbColors ] arg (=3) sets the number of successive colors used for
displaying 2d and 3d maximal segments (default
is 3: red, green, blue)
-t [ --tangent ] displays the tangents to the curve
Example:
$ 3dCurveViewer -C -b 1 -3 -2 -c ${
DGtal}/examples/samples/sinus.dat
You should obtain such a visualisation:
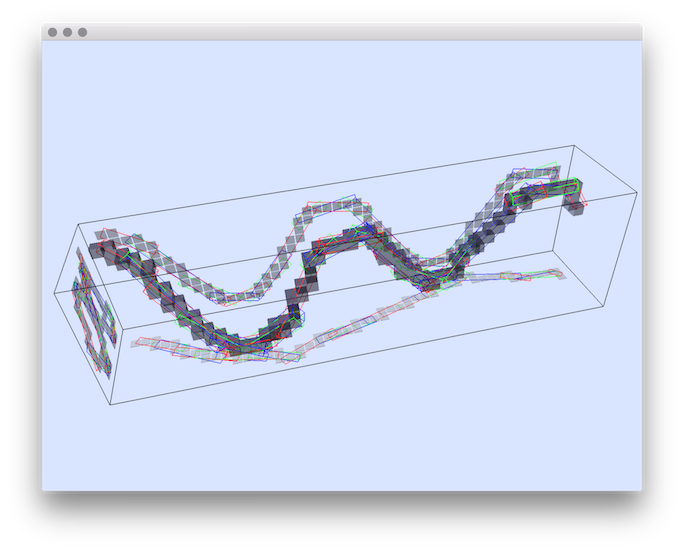
resulting visualisation of 3d curve with tangential cover.
- See also
- 3dCurveViewer.cpp
 1.8.10

