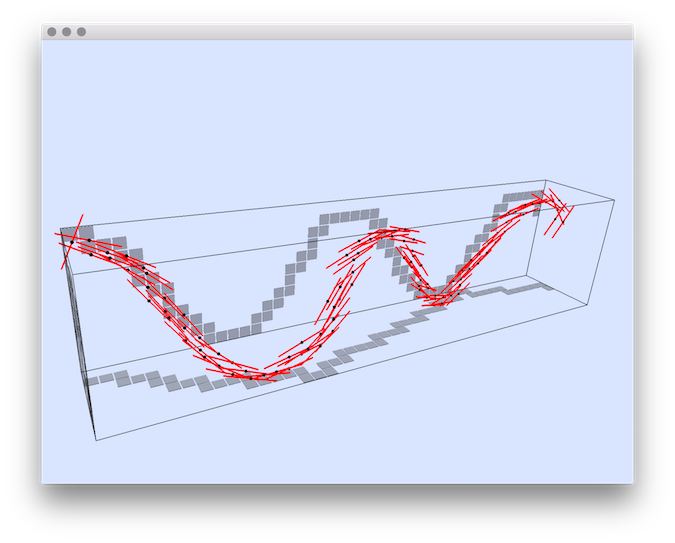
This program estimates the tangent vector to a set of 3D integer points, which are supposed to approximate a 3D curve.
This program estimates the tangent vector to a set of 3D integer points, which are supposed to approximate a 3D curve. This set of points is given as a list of points in file <input>. The tangent estimator uses either the digital Voronoi Covariance Measure (VCM) or the 3D lambda-Maximal Segment Tangent (L-MST). This program can also displays the curve and tangent estimations, and it can also extract maximal digital straight segments (2D and 3D).
Positionals:
1 TEXT:FILE REQUIRED the name of the text file containing the list of 3D points: (x y z) per line.
Options:
-h,--help Print this help message and exit
-i,--input TEXT:FILE REQUIRED the name of the text file containing the list of 3D points: (x y z) per line.
-V,--view TEXT=OFF toggles display ON/OFF
-b,--box INT=0 specifies the tightness of the bounding box around the curve with a given integer displacement <arg> to enlarge it (0 is tight)
-v,--viewBox TEXT:{WIRED,COLORED}=WIRED
displays the bounding box, <arg>=WIRED means that only edges are displayed, <arg>=COLORED adds colors for planes (XY is red, XZ green, YZ, blue).
-T,--connectivity TEXT:{6,26}=6 specifies whether it is a 6-connected curve or a 26-connected curve: arg=6 | 26.
-C,--curve3d displays the 3D curve
-c,--curve2d displays the 2D projections of the 3D curve on the bounding box
-3,--cover3d displays the 3D tangential cover of the curve
-2,--cover2d displays the 2D projections of the 3D tangential cover of the curve
-t,--tangent displays the tangents to the curve.
-n,--nbColors UINT=3 sets the number of successive colors used for displaying 2d and 3d maximal segments (default is 3: red, green, blue)
-R,--big-radius FLOAT=10 the radius parameter R in the VCM estimator.
-r,--small-radius FLOAT=3 the radius parameter r in the VCM estimator.
-m,--method TEXT:{VCM,L-MST}=VCM the method of tangent computation: VCM (default), L-MST.
-a,--axes TEXT:{ON,OFF}=OFF show main axes - prints list of axes for each point and color points color = (if X => 255, if Y => 255, if Z => 255)
-o,--output TEXT=3d-curve-tangent-estimations
the basename of the output text file which will contain points and tangent vectors: (x y z tx ty tz) per line