displayContours
Displays discrete contours.
Usage: displayContours [options] -i <fileName>
Allowed options are :
Positionals:
1 TEXT:FILE REQUIRED input FreemanChain file name
Options:
-h,--help Print this help message and exit
-i,--input TEXT:FILE input FreemanChain file name
-o,--outputFile TEXT save output file automatically according the file format extension.
--SDP TEXT:FILE Import a contour as a Sequence of Discrete Points (SDP format)
--SFP TEXT:FILE mport a contour as a Sequence of Floating Points (SFP format)
--drawContourPoint FLOAT <size> display contour points as disk of radius <size>
--fillContour fill the contours with default color (gray)
--lineWidth FLOAT Define the linewidth of the contour (SDP format)
-f,--drawPointOfIndex UINT Draw the contour point of index.
--pointSize FLOAT <size> Set the display point size of the point displayed by drawPointofIndex option (default 2.0)
--noXFIGHeader BOOLEAN to exclude xfig header in the resulting output stream (no effect with option -outputFile).
--withProcessing TEXT:{MS,FP,MLP} Processing (used only when the input is a Freeman chain (--input)):
DSS segmentation {DSS}
Maximal segments {MS}
Faithful Polygon {FP}
Minimum Length Polygon {MLP}
-v,--displayVectorField TEXT Add the display of a vector field represented by two floating coordinates. Each vector is displayed starting from the corresponding contour point coordinates.
--scaleVectorField FLOAT=1 set the scale of the vector field (default 1) (used with --displayVectorField).
--vectorFieldIndex UINT=[0,1] x 2 specify the vector field index (by default 0,1) (used with --displayVectorField).
--vectorFromAngle UINT specify that the vectors are defined from an angle value represented at the given index (by default 0) (used with --displayVectorField).
--rotateVectorField apply a CCW rotation of 90° (used with --displayVectorField).
--outputStreamEPS specify eps for output stream format.
--outputStreamSVG specify svg for output stream format.
--outputStreamFIG specify fig for output stream format.
--invertYaxis Needs: --SDP invertYaxis invert the Y axis for display contours (used only with --SDP)
--backgroundImage TEXT:FILE backgroundImage <filename> : display image as background
--alphaBG FLOAT=1 alphaBG <value> 0-1.0 to display the background image in transparency (default 1.0), (transparency works only if cairo is available)
--scale FLOAT=1 scale <value> 1: normal; >1 : larger ; <1 lower resolutions)
Example:
In this example we show how to display of a set of contours extracted in a single image. The first step is to extract a set contours by using the tool
$ img2freeman $DGtal/examples/samples/church.pgm -R 0 20 255 -s 200 > church.fc
Then, we display the set of contours with the background images (you need to have compiled DGTal with the options (-DWITH_MAGICK=true and -DWITH_CAIRO=true) :
$ displayContours church.fc --backgroundImage $DGtal/examples/samples/church.png --alphaBG 0.75 --outputFile church.pdf
You should obtain such a result:
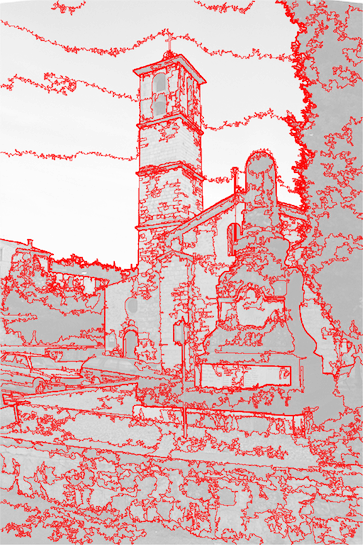
Resulting visualization.
- See also
- displayContours.cpp