Table of Contents
The objective of this tutorial is to perform some elementary volumetric analysis of 3D objects. With this tutorial, you will experiment the following DGtal features
- Import/export of a volumetric image (VolReader and VolWriter)
- Distance transformation computation (DistanceTransformation)
- Visualization of volumetric data (Viewer3D)
- Implicit/parametric shape construction (ImplicitBall)
- Shape analysis using granulometric function
Please use the following template file for this tutorial: volDTGranulo-template.cpp
Introduction
When analyzing 3D porous material, the granulometric function plays an important role for shape description. For short, given a shape \mathcal{X}, the granulometric function at a point x\in \mathcal{X} is given by:
g (x) = \max \{ r~|~ \forall c\in\mathcal{X}, x\in B(c,r)\text{ and }\forall B(c,r)\subseteq \mathcal{X}\}
B(c,r) being an Euclidean ball with center c and radius r.


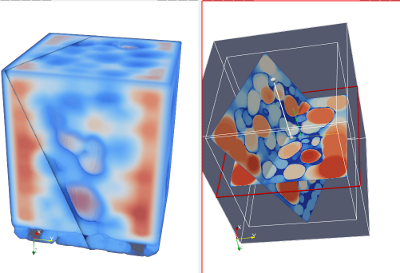
interior/exterior of a porous material (snow sample, courtesy of GAME-CNRM/CEN and ESRF) interior/exterior of a porous material (snow sample, courtesy of GAME-CNRM/CEN and ESRF)
To compute the granulometric function, a classical approach is to first consider the medial axis of \mathcal{X} (the medial axis can be roughly defined as the set of maximal balls contained in the shape).
In this tutorial, we will implement a first naive approach from distance transformation values. The distance transformation is a function defined by
DT (x) = \min \{ d(x,\hat{x}~|~ x\in\mathcal{X}\text{ and }\hat{x}\in \mathbb{R}^n\setminus \mathcal{X}\}
for some metric d.
Hence, instead of checking all Euclidean balls inside \mathcal{X}, we can just consider the digital balls B(x, DT(x)) for all x\in\mathcal{X} (in this case, d is the l_2 Euclidean norm).
Import volumetric image an visualization
Let start with volumetric image loading. First of all, create a source file with the following includes (or copy the volDTGranulo-tempate.cpp source file):
- Define a type (typedef) for the image container you want to use (ImageContainerBySTLVector, ImageContainerBySTLMap, ....)
- Use the VolReader to load a volumetric file and store it into a previously defined image type.
Once you have imported the volumetric file, you can check its geometry with the internal Viewer3D visualization tool. First of all, create a new viewer instance using the following code:
- Note
- Please have a look to Display3D: a stream mechanism for displaying 3D DGtal objects for more details on DGtal viewer.
At this point, just send to the viewer the grid points with strictly positive values.
Distance Transformation
- First of all, have a look to the DistanceTransformation class and check the template type you have to specified to this class to create an instance.
- As you may have seen, one of the input is a binary predicate which characterizes the shape (model of concepts::CPointPredicate concept). Use the functors::SimpleThresholdForegroundPredicate to create a point predicate from an image and a thresold.
- Now, create a distance map from this point predicate and an Eucildean l_2 norm.
- Create a new Viewer3D instance and visualize the distance map values. Two things would be helpful:
- If you want to add a clipping plane to the viewer, a simple object has been defined in DGtal: viewer << DGtal::ClippingPlane(1,0,0,-10.1);Class for adding a Clipping plane through the Viewer3D stream. Realizes the concept CDrawableWithView...Definition: DrawWithDisplay3DModifier.h:157
- The following code will create a nice colormap to map DT values to colors. //Create the colormap from the maximal distance value//and a GradientColorMapDT::Value maxDT = (*boost::first_max_element(distancemap.constRange().begin(),distancemap.constRange().end()));GradientColorMap<DT::Value> gradient( 0, maxDT);gradient.addColor(DGtal::Color::Blue);gradient.addColor(DGtal::Color::Green);gradient.addColor(DGtal::Color::Yellow);gradient.addColor(DGtal::Color::Red);
- If you want to add a clipping plane to the viewer, a simple object has been defined in DGtal:
Granulometric function
As discussed in the introduction, we will implement a very naive version of the granulometric function extraction. The main idea is to construct an image storing the g function. The algorithm is the following one:
- Initiaize the map g with 0 at each point
- For each grid points x in the object
- Create a Ball centered at x with radius DT(x)
- Iteratate over all points y in this ball
- If the value g(y) is less than DT(x), set g(y)=DT(x)
- Create an empty image g with the same size as the input vol file.
- Create a first ball (e.g. centered in the middle of the image) using the ImplicitBall class. This class creates an implicit ball such that the () operator is posivive at a point if the point is inside the shape (model of CBoundedEuclideanShape). A basic way to scan grid points inside an ImplicitBall is to construct a Domain from its bounding box, then you scan all points in this domain and check the operator() sign to decide if the point is inside or not.
- Note
- More advanced digitization processes are given by GaussDigitizer.
- Implement the above mentioned granulometric function algorithm: at each point of the DT map, create a ball and check its interior point to update the function g .
- Again, use a new Viewer3D object to visualize the granulometric function.
- Export the final map to a vol file. In this case, consider the VolWriter class (granuloImage is the name of image structure storing the g map):
- What is the computational cost of this naive approach for a shape defined in a N^3 domain ?
Conclusion
You can check volDTGranulo.cpp to get some answers to the above mentioned questions.
Several optimizations can be developed. For example, before constructing the granulometric function, one can use medial axis extraction to drastically reduce the number of balls to scan. Then, sorting the balls by their radii may be helpful to implement fast propagation based granulometric/thickness function from the PowerMap (see for instance [33]).